

Do you believe that the history of Elasticsearch was started from cooking recipe app which required a search engine system for managing more and more recipe list day by day? Firstly, it was named Compass, and then it was changed to Elasticsearch until now. Elasticsearch has been written in Lucene Library which is open-source and have high-performance collaborated by power, accuracy, and efficiency and Lucene Library itself was built in Java.
If we are discussing about Elasticsearch, we can’t let visualization and data shippers go.
In this analysis, we will discuss some cases:
- How the concept of Elasticsearch works?
- Who are the competitors on Elasticsearch marketplace?
- Why we use Alibaba Elasticsearch?
- How to implement Log Management?
Concept
In concept, Elasticsearch has node, cluster, index, document, shard, and replicas. Node is a single running instance; Cluster is a set of nodes which provides collective indexing and search for every single node; Index is a type of collection data which different between documents and its properties and using shard concept to improve performance; Document is collection of fields defined in JSON; Shard used to make index horizontally subdivided; Replica used to create replicas of index and shard.
In basic log collection and visualization, the keys of them are Elasticsearch, Beats, and Kibana.
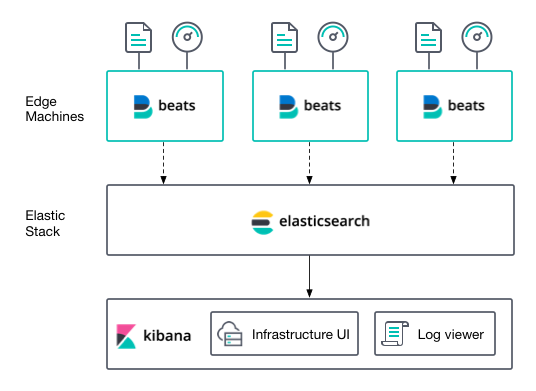
Elasticsearch used to index streams of semi-structured data, such as logs or metrics. Beats is one of data shipper and it’s used to be installed as agent on your servers and send the log to Elasticsearch. Kibana is used to visualize data analysis in many varieties (chart, table, map, etc.) and interact with data stored in Elasticsearch.
Talking about Beats, as data shipper, it has many types like Auditbeat, Filebeat, Functionbeat, Heartbeat, Journalbeat, Metricbeat, Packetbeat, and Winlogbeat. Auditbeat is used to collect and centralize audit events from Linux Audit Network; Filebeat is used to forward and centralize log data which taken from log files from location that you specify and collect your log events; Functionbeat is used to collect data from services that you deploy in your serverless environment; Heartbeat is used to check your service availability periodically (reachable); Journalbeat is used to forward and collect data from system journal; Metricbeat is used to collect metrics from services running on server and check your operating system periodically; Packetbeat is used to capture the network traffic between your app server, decode the application layer protocol (HTTP, MYSQL, etc.), correlate the request with the responses and record interesting fields for each transaction; Winlogbeat is used to collect windows event logs.
For Kibana, as visualization, lets you visualize your Elasticsearch data and do tracking query load to understand the way of requests flow through your apps. You can create dashboard to fulfil your metrics with the things that you need, you can also add filter to make your data more specific. Discover is used as feature that you can possibly access every single document on index, search your data and filter the result, view events which selected by timestamp.
Benefits
| Alibaba Cloud | AWS | GCP | |
| SLA | available | available | – |
| XPack | available (by default) | – | – |
| SIEM | available | available | available |
| APM | available | available | available |
In Alibaba Cloud, it has 99.9% for service availability and a lot more than service availability percentage for data availability, XPack by default, and it can implement SIEM and APM.
In AWS, it has SLA (99.90%), no XPack by default, but it can implement SIEM and APM.
In GCP, I don’t see any information which mentioning about SLA, no XPack by default, but it can implement SIEM and APM.
Implementation
For the implementation, we will start from creating the cluster of Elasticsearch by using Alibaba Elasticsearch.
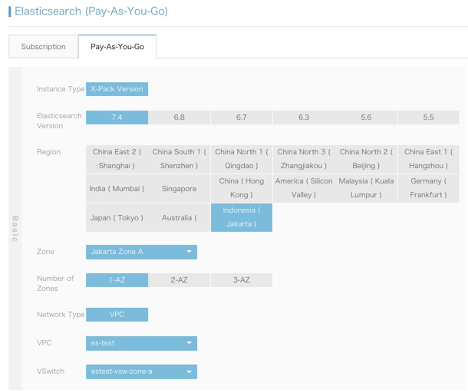
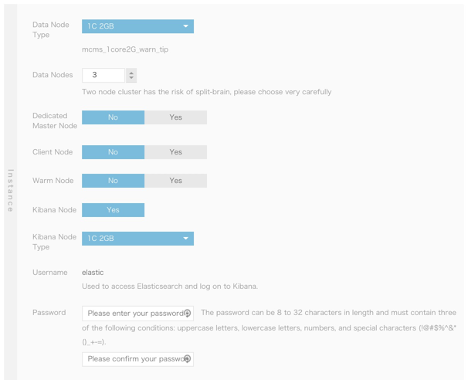
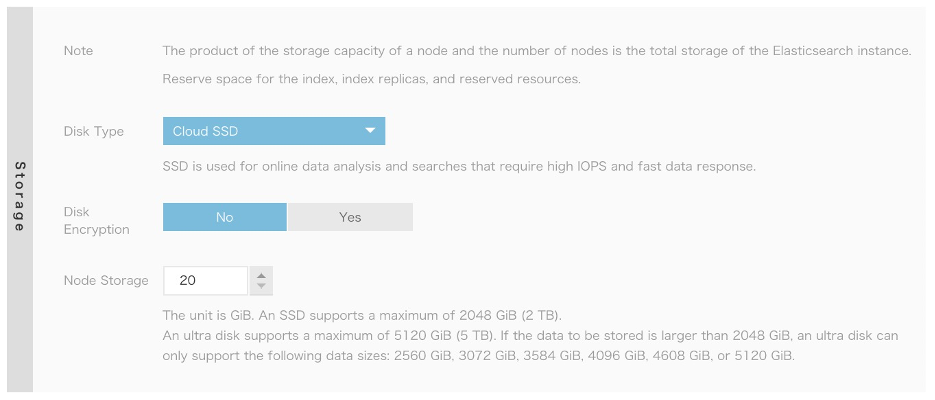
In Picture 3, there are 3 parts such as Basic, Instance, and Storage.
Inside Basic section, by default you can use X-Pack version. You can choose billing method (Pay As You Go/ Subscription), version of Elasticsearch, Region, Zone, Number of Zones for improving your Availability, Network Type, VPC, and VSwitch.
Inside Instance section, you can choose your Data Node Type, 1 CPU and 2 GB Memory or the others, number of data node (minimum 2 nodes), dedicated master node, client node, warm node, kibana node (by default yes), kibana node type (you can choose freely just like Data Node type), for username it’s default (elastic), password will be used to authenticate to Elasticsearch and logon to Kibana.
Inside Storage section, you can choose disk type, using disk encryption and size of node storage.
If you were finished the selection of used feature, you can go to Elasticsearch Clusters (make sure you hit the true region as you choose before.
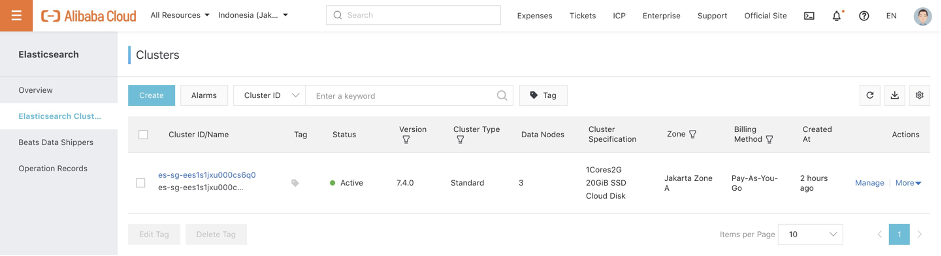
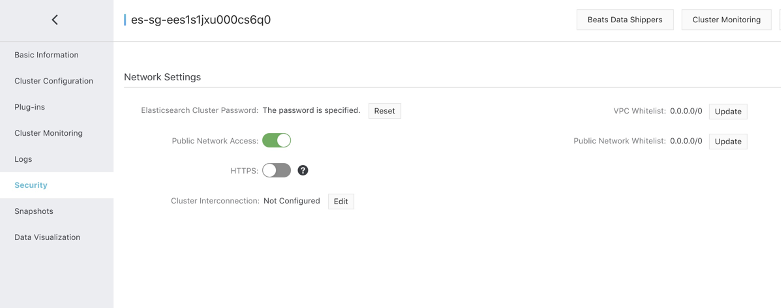
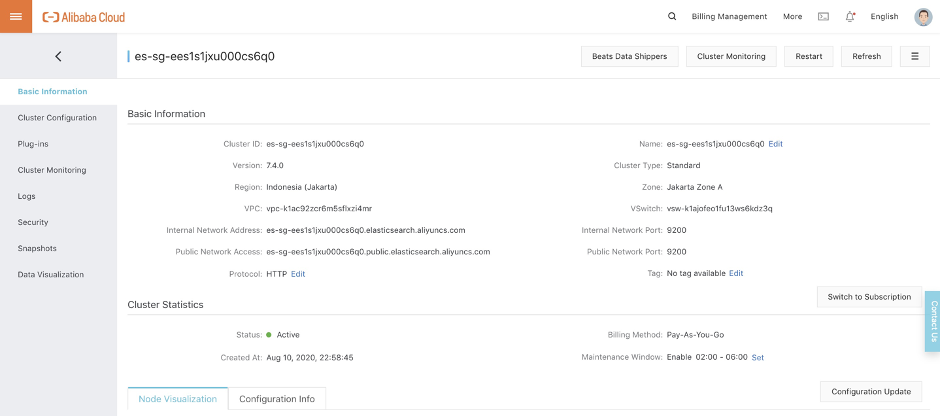
Wait the cluster until successfully created, then click the Cluster ID or click manage to see more detail of your cluster. You need to change some config inside your cluster like Public Network Access (publicly accessed) and set the Public Network Whitelist (0.0.0.0/0) in Security Section. For public network access, it’s not best practice and not always necessary unless there is the needs for opening connection to public. Regarding security reason, better to turn this off by default, then it can be only visited by the same VPC Network (you can create VPN to your internal VPC and access your cluster by using VPN). For practice purpose, we will enable the Public Network Access.
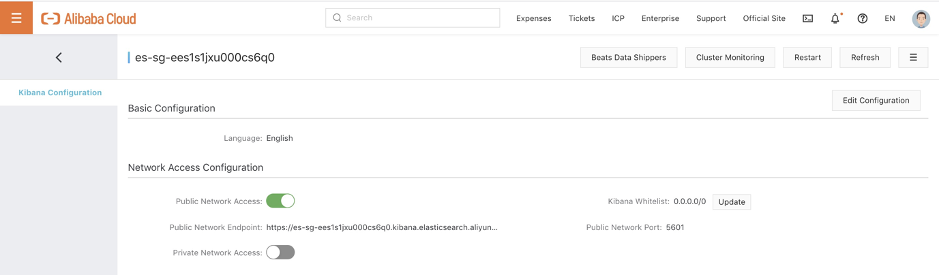
Not only Security Section, but also Kibana config. You need to set it public. It can be changed from Data Visualization section >> Edit Configuration >> Public Network Access.
Open Kibana console from Data Visualization section >> Console. It will need username and password. You can fill username and password by settings that you do on cluster preparation. If you forgot your password, you can go to Security Section >> Reset, and enter the password you want. By default, the username is elastic.
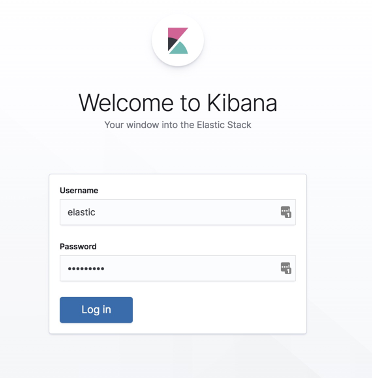
The main page will be like this.
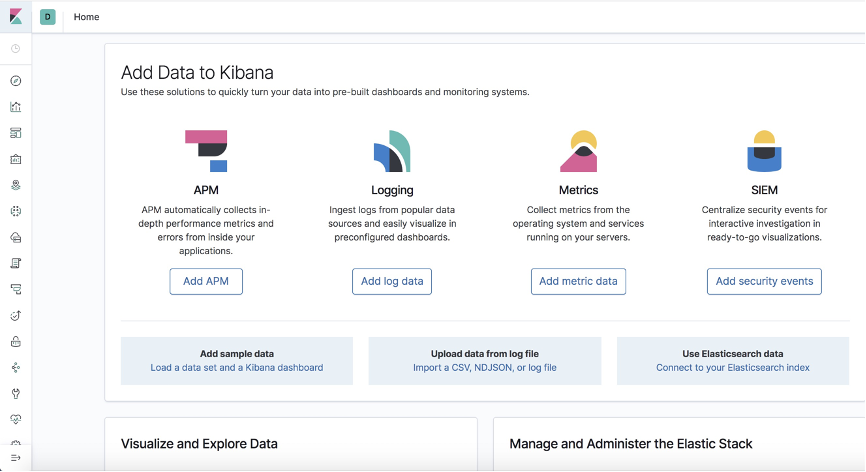
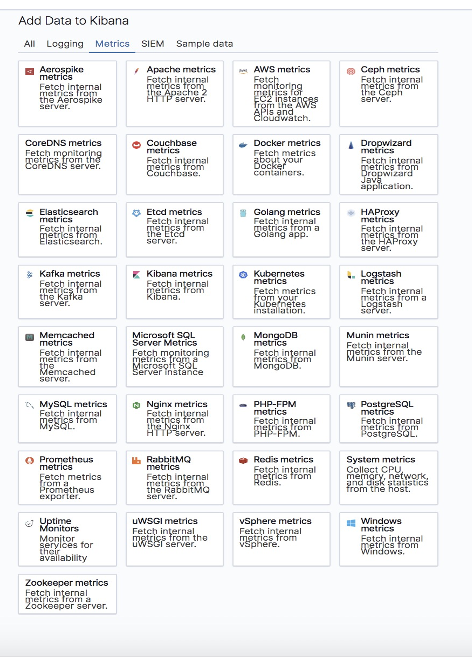
You can use several types for adding data to your visualization (Kibana). APM, Logging, Metrics, SIEM, you can choose freely as your own needs. We will try System Metrics on Metrics. In System Metrics, we can collect some data like CPU Utilization, Memory Utilization, Network (Incoming/Outgoing), Disk statistic of host.
We need a target, we will use small spec ECS instance which installed CentOS 7.8 as Operating System. We will inject the agent (system metrics) over the instance.
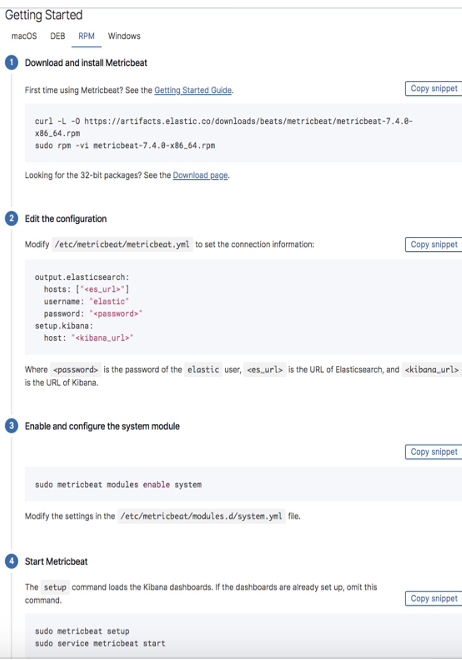
We can follow the steps in Picture 9.
After download and install Metricbeat, you need to edit metricbeat configuration. For metricbeat, you can find this line and configure by your own.
| output.elasticsearch: hosts: [“es-sg-ees1s1jxu000cs6q0.public.elasticsearch.aliyuncs.com:9200”] username: “elastic” password: “Test_1234” setup.kibana: host: “https://es-sg-ees1s1jxu000cs6q0.kibana.elasticsearch.aliyuncs.com:5601” |
Hosts of output.elasticsearch can be taken from Basic Information section (public network access was added after user enables public network access from security section). And for host of setup.kibana, you can see on Kibana configuration (refer to Picture 6).
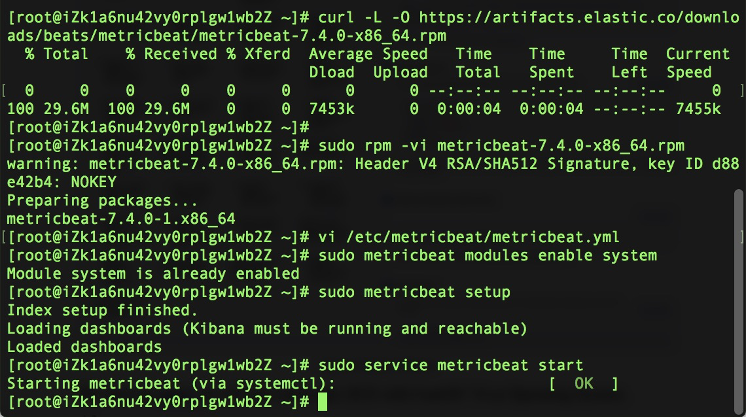
The next step (after you edit the configuration) is Enable your system module by:
| # metricbeat modules enable system ———–Start metricbeat by: # metricbeat setup # service metricbeat setup |
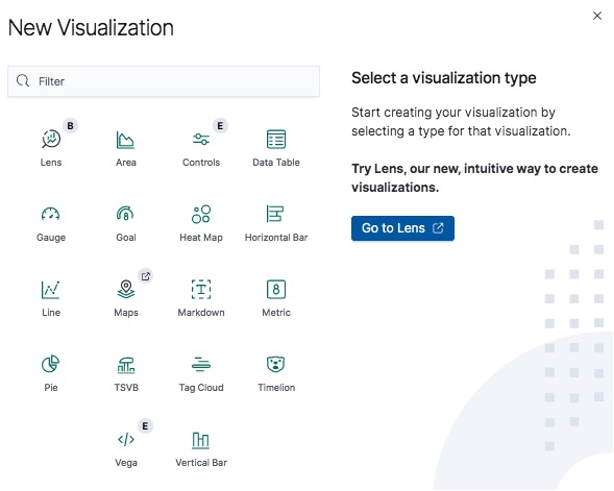
After that, check the module status. Is the module status “data successfully received” or not? If success, you can choose to check it to dashboard (default dashboard), or you can discover your log on index. You can add new panel for your dashboard by using set collection of visualization types.
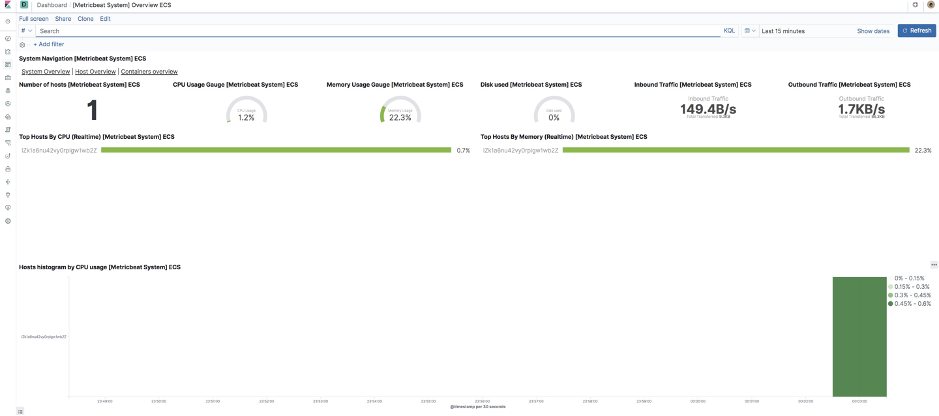
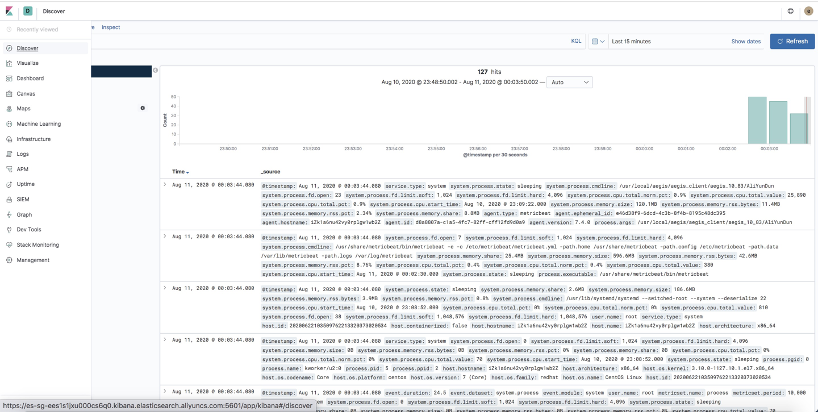
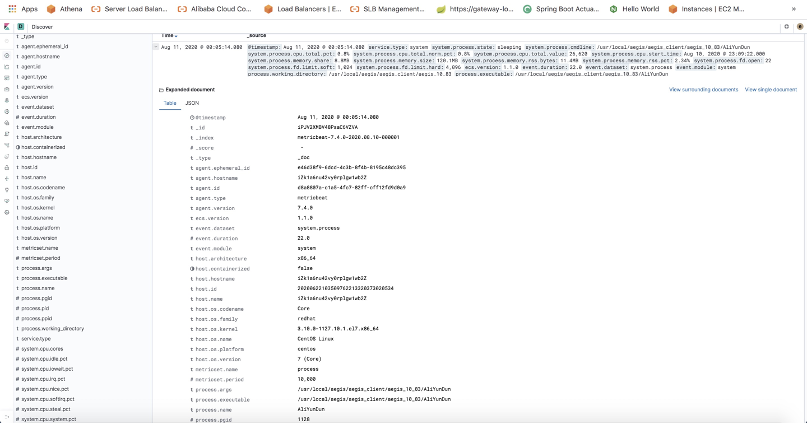
From discover you can check your received data by timestamp, and maybe filter if you need more specific results.
Conclusion
Elasticsearch is a tool which has node, cluster, index, document, shard, and replicas. Many peoples are using it and integrating Elasticsearch with their applications. It has so many features such as discover, dashboard, machine learning, SIEM, etc. By default, XPack can be used on Alibaba Cloud Elasticsearch and make use of XPack for accessing some locked features without additional licenses like Authentication Security, Machine Learning, etc. You can visualize or add panels on your dashboard by using various of visualization types like Area, Data Table, Metric, Line, Pie, Time Series Visual Builder (TSVB).
Elasticsearch can use Index Lifecycle Management (ILM) feature, which automatically manage indices to spin up a new index, delete index within data retention standards. Also, elasticsearch has machine learning feature and able to forecast the data log movement.
In the end, elasticsearch is a popular tool and going to be trusted for analyzing log, showing full text, analyzing business and alerting.
References
- Alibaba Cloud. Product Introduction. https://www.alibabacloud.com/help/product/57736.htm?spm=a3c0i.11423562.3559839250.4.12941e08pkL0db
- Elastic. Beats. https://www.elastic.co/beats/
- Alibaba Cloud. 2020. Elasticsearch Service Level Agreement. https://www.alibabacloud.com/help/doc-detail/154645.htm
- Tutorialspoint. Elasticsearch. https://www.tutorialspoint.com/elasticsearch/elasticsearch_tutorial.pdf
- Lucene. Apache Lucene Core. https://lucene.apache.org/core/
- Kelbert, F. 2019. How to Ingest Data Into Elasticsearch Service. https://www.elastic.co/blog/how-to-ingest-data-into-elasticsearch-service